
Picking a fulfillment center feels straightforward until you’re three proposals deep and realizing that every provider looks identical on a one-pager. The real fulfillment center features to compare go far beyond storage rates and shipping speed. We’re talking about system integrations, enforceable SLAs, total cost modeling, and value-added services that either scale with your brand or quietly create bottlenecks. Third-party logistics (3PL) is the industry term for what most people call a fulfillment center, and understanding both helps you ask sharper questions when you’re evaluating providers.
Table of Contents
- Key takeaways
- 1. The core fulfillment center features to compare
- 2. Technology and system integration
- 3. SLA definitions and performance accountability
- 4. Pricing structure and total cost transparency
- 5. Value-added services that differentiate providers
- 6. Location, facility design, and scalability
- 7. Building your final evaluation framework
- My honest take after years of watching these decisions go wrong
- How Usiprep addresses everything on this list
- FAQ
Key takeaways
| Point | Details |
|---|---|
| Technology integration matters most | Real-time API or EDI sync prevents inventory errors that batch-update systems consistently miss. |
| SLA gaps are well-documented | Contracted targets routinely outperform actual 3PL delivery, making measurable KPIs non-negotiable. |
| Total cost beats headline rates | Normalize all cost scenarios including peak and returns before comparing any two providers. |
| Value-added services add real leverage | Kitting, custom packaging, and returns grading reduce your own labor costs and improve customer experience. |
| Use a weighted scorecard | Objective scoring by business priority removes gut-feel bias from your final provider decision. |
1. The core fulfillment center features to compare
Before you request a proposal, know what you are actually evaluating. The features of fulfillment centers that drive real operational outcomes fall into four categories: technology, performance guarantees, pricing structure, and service flexibility. Most brands focus only on pick/pack rates and miss the other three entirely.
When you compare fulfillment services side by side, treat each category as a separate scorecard column. A provider with a great pick rate but no API integration will cost you far more in manual corrections over six months than a slightly higher per-unit fee would have.
2. Technology and system integration
Technology is where the biggest day-to-day operational differences show up. A warehouse management system (WMS) that connects to your Shopify or WooCommerce store via live API behaves completely differently than one that syncs inventory once an hour through a batch file. Systems limited to batch updates consistently lag on inventory and order accuracy SLAs. That lag compounds fast when you’re running flash sales or launching new SKUs.
When you evaluate a provider’s tech stack, ask specifically about:
- Automated order routing: Does the system assign orders to picking stations without human intervention?
- Exception handling: How does the WMS flag and resolve discrepancies, short shipments, or unscanned inbound items?
- EDI/API machine integration: Is the connection event-driven or schedule-driven? Event-driven wins.
- Kitting and bundling support: Can the WMS execute multi-SKU kits natively, or does it require manual workarounds?
Pro Tip: Ask your shortlisted providers for a live integration map showing every current eCommerce platform connection. If they can’t produce it within 24 hours, their tech team is not maintaining it in real time, and that will hurt you.
You can also explore how Shopify Flow automation can complement your 3PL’s WMS by triggering fulfillment workflows directly from your store side.
3. SLA definitions and performance accountability
SLAs are where the marketing pitch meets operational reality. The key aspects of fulfillment centers that determine daily reliability all live here: OTIF (on-time in-full), pick and pack accuracy, dock-to-stock time, inventory record accuracy, damage rate, and return processing time.
Here is what current 3PL performance data actually shows:
| Metric | Contracted Target | Median Actual |
|---|---|---|
| OTIF | 98.0% | 94.2% |
| Pick & pack accuracy | 99.7% | 99.1% |
| Dock-to-stock time | ≤48 hours | 62 hours |
| Return processing | ≤72 hours | 94 hours |
Source: The 2026 State of 3PL Performance
Those gaps are not theoretical. A 3.8-point OTIF deficit translates directly into late shipments, customer complaints, and lost repeat purchases. Yet only 22% of brands review their 3PL’s SLA performance monthly, and 44% have never compared contracted targets to actual delivery data.
The return processing situation deserves special attention. Return processing delays more than double during Q4 peak season, yet most contracts define no peak-specific return SLA at all. That creates a window where restocking delays quietly kill your available inventory heading into your highest revenue weeks.
A good SLA includes the measurable event, the time window, the proof source, the exclusion conditions, and the penalty. Anything less is a wish list, not a contract.
Effective SLA design requires exact definitions and agreed penalties so both parties know what accountability looks like before there is ever a dispute.
Pro Tip: Require your provider to include a peak-season return SLA addendum covering October through January. If they resist, ask why. The answer will tell you everything you need to know about their Q4 capacity planning.
4. Pricing structure and total cost transparency
Headline rates lie. Not intentionally, but structurally. When you compare fulfillment pricing using only pick/pack and storage, you miss the costs that actually swing your unit economics.
Here are the cost categories you must model for every provider you evaluate:
| Cost Category | What to Clarify |
|---|---|
| Receiving | Per pallet, per carton, per SKU, or hourly? |
| Storage | Per bin, per cubic foot, or per pallet per month? |
| Pick & pack | Per order, per unit, or tiered by volume? |
| Returns processing | Flat fee or per-item labor charge? |
| Accessorial fees | Fuel surcharge, address correction, Saturday delivery? |
| Account management | Included or billed separately above a threshold? |
The right approach is a normalized cost model that runs three scenarios: your current baseline volume, a 2x peak scenario, and a stress scenario at 3x volume. Then compare the total landed cost per order across providers in all three. You will often find that the cheapest base rate becomes the most expensive option at peak.
Negotiation levers worth pushing on include fee caps for receiving overages, waived accessorial fees above a monthly order threshold, and dedicated account rep support built into the base contract rather than priced as an upsell.
To get a complete picture of what you should be accounting for, the breakdown of fulfillment cost components is worth reviewing before you finalize any cost model.
5. Value-added services that differentiate providers
Not every fulfillment center does the same things. The best fulfillment center attributes often show up in capabilities that don’t appear in the base pricing sheet. These are the services that reduce your in-house labor and improve the customer unboxing experience.
Key value-added services worth comparing:
- Kitting and light assembly: Can the provider kit multi-SKU orders at scale without creating a custom project each time? Native kitting features, including automated shipment timing for Drip Campaigns and Pocket Folder Kits, reduce manual errors and support scheduled multi-wave shipments without extra development cost.
- Custom packaging: Does the center support branded inserts, custom box sizes, or poly-bag printing? Or does everything ship in a plain brown box?
- Returns grading and triage: Can returned items be graded (A/B/C condition), relabeled, and restocked automatically, or does everything queue for manual inspection?
- Exception handling: How does the center process damaged goods, short shipments from your suppliers, or late inbound freight? Is there a documented workflow, or does it go to a general inbox?
- Advanced analytics: Does the provider offer SKU-level velocity reports, days-of-inventory-remaining alerts, or carrier performance breakdowns? Or just a dashboard with order counts?
Pro Tip: Ask for three real examples of exception handling cases the provider resolved in the past 90 days. Process answers beat promise answers every time.
6. Location, facility design, and scalability
Warehouse location affects delivery speed and carrier costs directly. A single facility in the Midwest reaches roughly 70% of the U.S. population within two days by ground. Multiple nodes reduce average transit time but add complexity and minimum volume requirements.
Beyond geography, the physical design of a facility shapes its efficiency. Facility layout evaluation should assess receiving zones, shipping zones, slotting logic, dock scheduling, and how the operation handles surge volume. A warehouse that runs smoothly at 60% capacity can become chaotic at 90% during Q4 if the design does not support congestion management.

Ask specifically: What is their peak capacity ceiling as a percentage of normal operations? What happens to your orders when they hit it?
7. Building your final evaluation framework
A weighted scorecard removes subjective bias from your final decision. Here is how to build one that actually works:
- Categorize all criteria into three buckets: non-negotiables (deal breakers if absent), preferred (strongly favored but flexible), and optional differentiators (nice to have, not worth paying a premium for).
- Assign weights by business priority. If you sell high-SKU-count products with frequent kitting, technology and kitting capability might carry 30% of your total score. If you sell simple replenishment items, pricing and OTIF weighting rises.
- Score each provider on a 1-5 scale per criterion, multiply by weight, and sum the columns.
- Run a scenario stress test. Plug each provider into your normalized cost model for base, peak, and stress volumes and compare total landed cost alongside the scorecard result.
- Include contingency and scalability questions. What is the provider’s disaster recovery plan? Can they absorb a 40% volume increase in 30 days’ notice? Get answers in writing.
The scorecard does not make the decision for you. It surfaces assumptions and trade-offs that gut feel hides.
My honest take after years of watching these decisions go wrong
I have watched hundreds of eCommerce brands approach fulfillment center comparisons the same way: they get three proposals, compare the pick/pack line item, and sign with the lowest number. Then they spend the next six months untangling inventory discrepancies, chasing credit memos for SLA misses that were never enforced, and paying accessorial fees they never budgeted for.
The real problems almost never come from a bad warehouse floor. They come from accountability deficits. You need contracts with real teeth. Measurable KPIs with proof sources and financial penalties are the only things that align incentives. Without them, you are essentially relying on a provider’s goodwill to maintain performance standards under pressure.
The technology integration point is where I see the most dangerous assumptions. A provider showing you a clean dashboard is not the same as a provider running event-driven API integrations. Ask to see the actual API logs from a current client’s integration. If they cannot show you, their “real-time sync” is probably a scheduled task running every 15 minutes.
And please, negotiate peak-season return SLAs before you sign. Q4 return delays are not an act of nature. They are a predictable consequence of under-specifying the contract.
— Akbar
How Usiprep addresses everything on this list
If you have worked through this comparison and want a provider that was built around these exact pain points, Usiprep is worth a direct look.
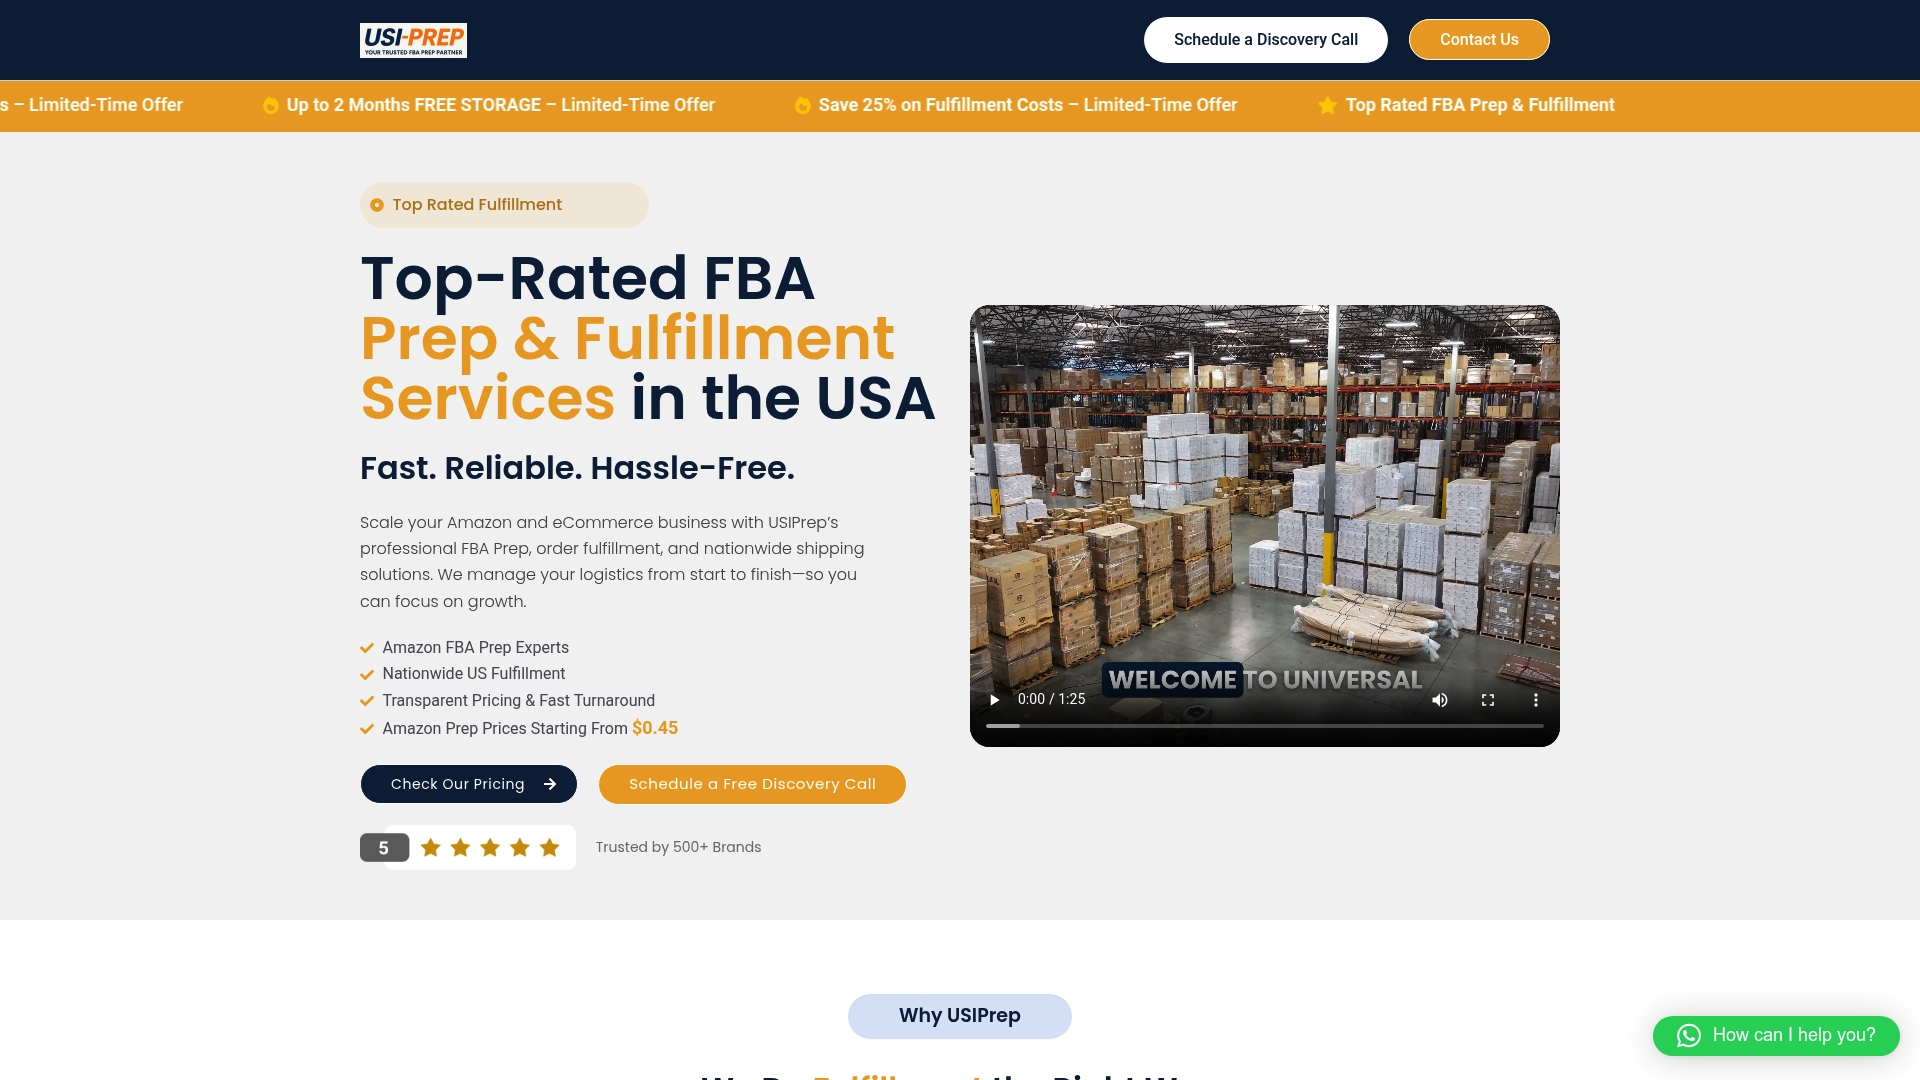
Founded by former Amazon sellers, Usiprep was designed specifically to address the frustrations this article describes. Transparent pricing with no hidden accessorial traps. A 98.9% on-time delivery rate. Fast inventory check-ins with full visibility throughout the process. And a 30% reduction in fulfillment costs that many clients see within the first year.
Start with the FBA prep requirements checklist to see exactly what compliance looks like from day one, or review the FBA shipment checklist to understand how Usiprep structures the preparation process from receiving through dispatch.
FAQ
What are the most important fulfillment center features to compare?
Focus on four areas: technology integration (API/EDI), SLA definitions with enforceable penalties, total cost modeling across all fee categories, and value-added services like kitting and returns grading. Comparing only pick/pack rates produces misleading results.
How do I identify hidden fees in a fulfillment proposal?
Request a full accessorial fee schedule and ask the provider to walk through a peak-season invoice example. Common hidden costs include receiving overages, address corrections, and account management charges billed above a monthly order threshold.
What is a good OTIF benchmark for a 3PL?
A contracted OTIF target of 98.0% is standard, but median actual performance across the industry sits at 94.2%. Hold any provider accountable to at least 97% with documented penalties for sustained underperformance.
Why do return SLAs matter so much during Q4?
Return processing time already runs at a median of 94 hours against a 72-hour target. During Q4, delays worsen further and most contracts include no peak-specific SLA at all, which means delayed restocking during your highest-revenue period with no contractual recourse.
What is a weighted scorecard and why should I use one?
A weighted scorecard assigns numerical importance to each evaluation criterion based on your business priorities, then scores each provider against those criteria. It replaces gut-feel comparisons with an objective, repeatable framework that surfaces trade-offs you would otherwise miss.